

How CRM and BI Turn Customer Data Into Better Decisions
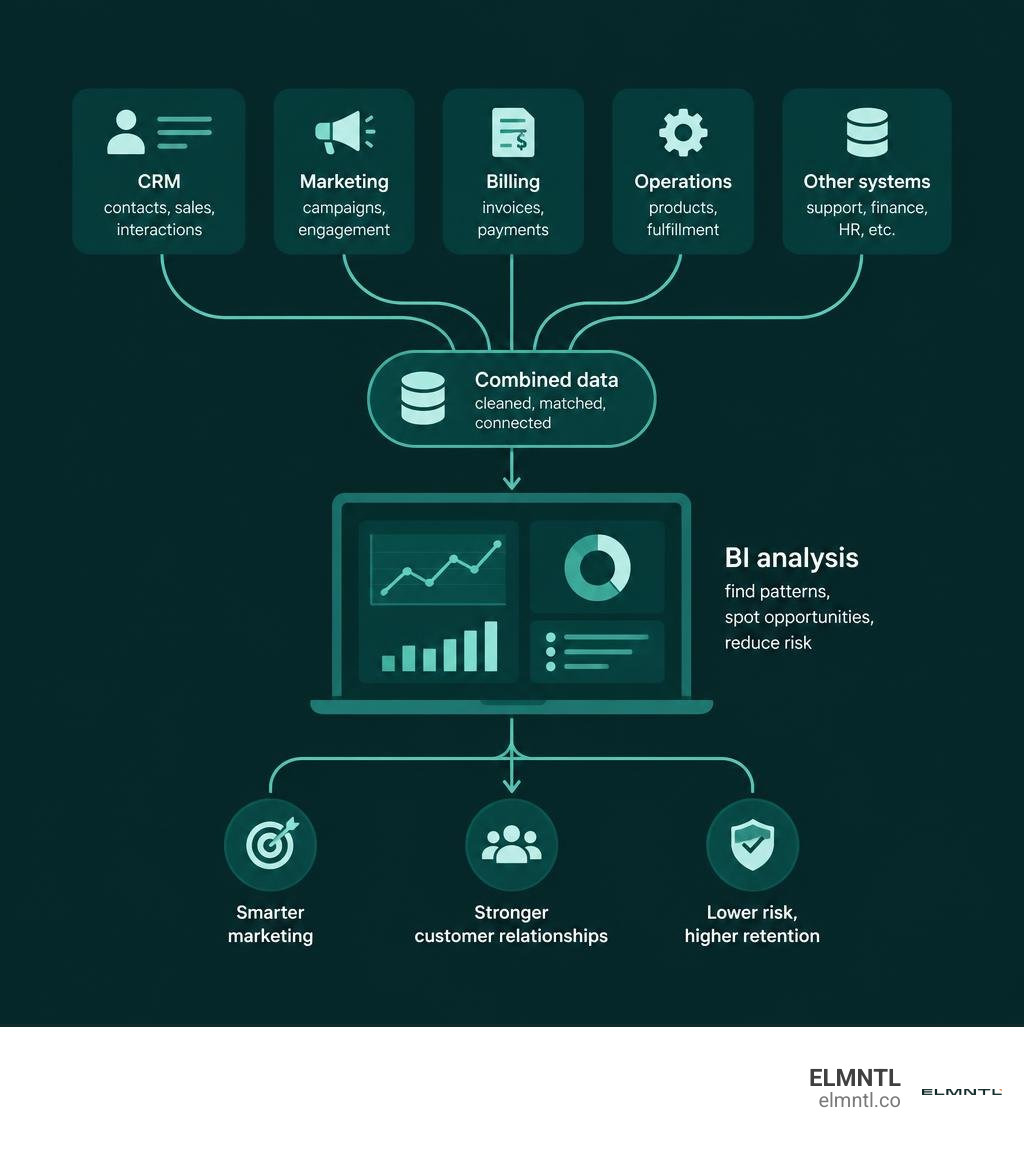
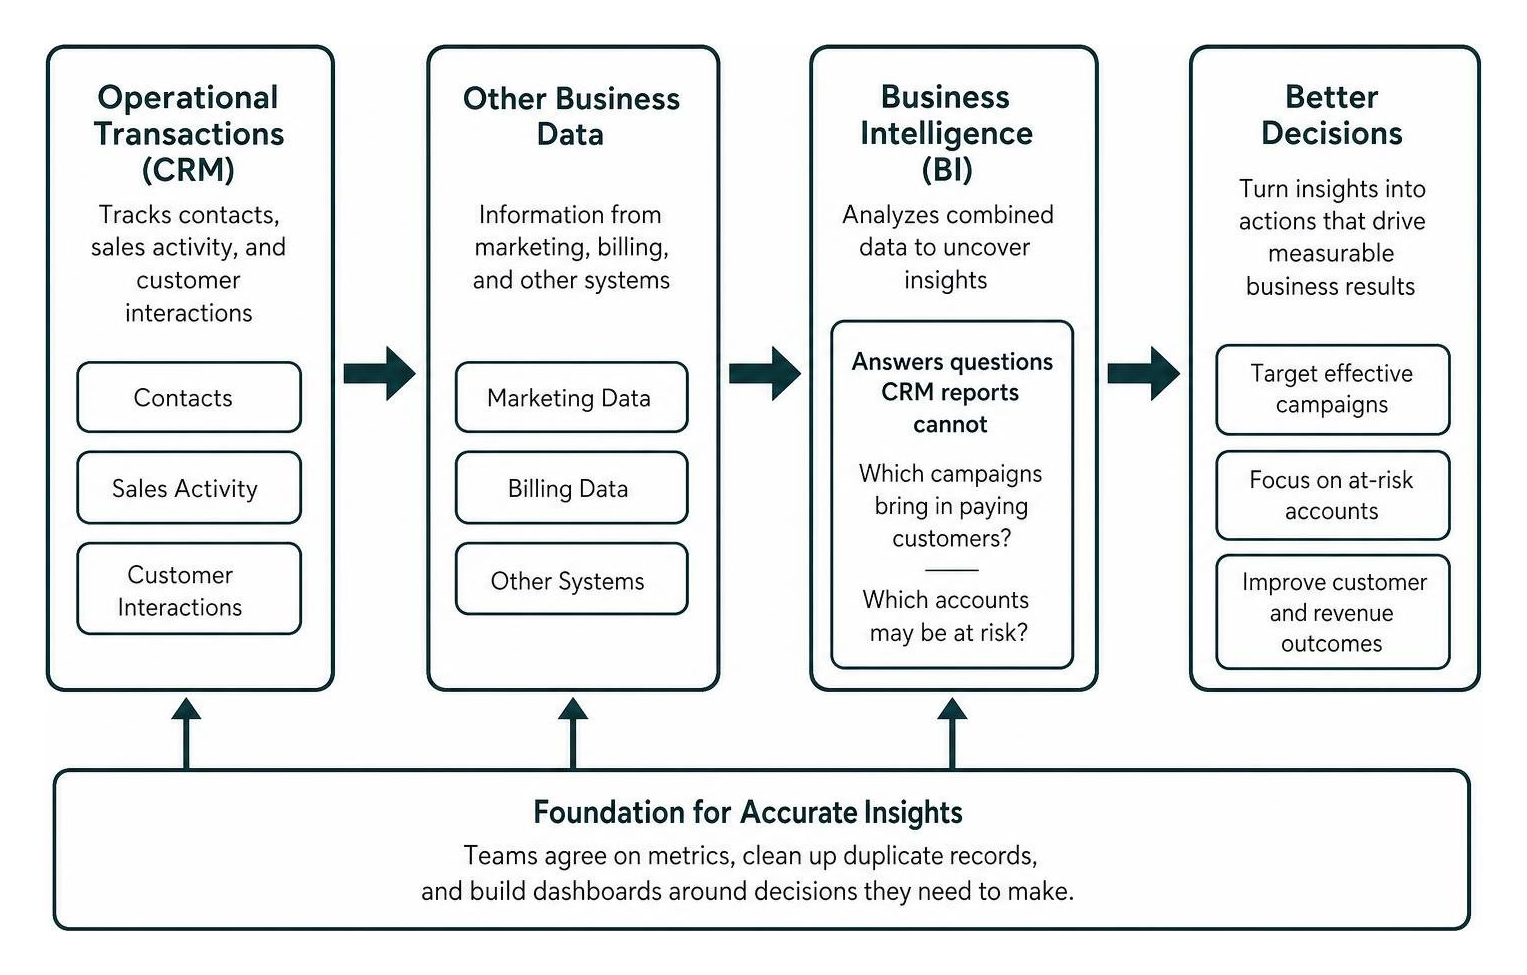
CRM and BI do different jobs. A customer relationship management (CRM) system tracks contacts, sales activity, and customer interactions. Business intelligence (BI) analyzes that data alongside information from marketing, billing, and other systems. Connect them when CRM reports cannot answer questions such as which campaigns bring in paying customers or which accounts may be at risk.
The connection works best when teams agree on what each metric means, clean up duplicate records, and build dashboards around decisions they need to make. Without that groundwork, a polished chart can still give you the wrong answer.
Crm and bi word list:
Core Differences Between CRM and BI Systems
Understanding how modern organizations manage and interpret data begins with distinguishing between operational tools and analytical platforms. While both technologies deal with customer records, their architecture, data handling, and primary objectives serve entirely distinct business needs.
Operational CRM vs. Analytical Platforms
Operational CRM platforms function as the daily system of record for customer-facing teams. They are built on transactional databases designed for fast input and real-time retrieval of individual records. Sales reps log calls, marketing teams deploy lead sequences, and support agents manage tickets directly within the tool. Implementing a robust modern CRM software infrastructure ensures that these day-to-day front-office touchpoints remain structured and accessible.
However, transactional systems are inherently constrained when evaluating complex relationships over time. A CRM answers immediate, operational questions: What is the deal size? Who was the last representative to speak with this contact? What stage is this deal in today?
Analytical BI platforms, conversely, aggregate information across weeks, months, or years. Instead of modifying single records, BI tools read bulk data, evaluate historical trends, and model future scenarios through strategic forecasting.
| Capability | Operational CRM | Analytical Business Intelligence (BI) |
|---|---|---|
| Primary Focus | Managing daily customer interactions and workflows | Analyzing cross-departmental business performance |
| Data Scope | Single-domain (sales, marketing, customer support) | Multi-domain (CRM, ERP, billing, operations, product) |
| Database Architecture | Transactional (optimized for quick record reads/writes) | Analytical (optimized for complex queries and aggregations) |
| Core Output | Contact logs, open pipeline stages, active tasks | Trend forecasting, multi-touch attribution, cohort analysis |
| Primary Users | Sales reps, support agents, frontline managers | Executives, revenue operations, financial analysts |
Single-System Data vs. Cross-Functional Intelligence
The fundamental limitation of relying solely on CRM reporting is data isolation. Your CRM records when a lead converts into an opportunity and signs a contract. Yet, it rarely reveals whether that customer paid their invoices on time, how actively they use your digital product, or if fulfillment costs ate away your profit margins.
BI eliminates data silos by blending CRM records with external sources, including enterprise resource planning (ERP) systems, accounting ledgers, web analytics, and help-desk logs. This multi-source data aggregation translates isolated touchpoints into cohesive commercial intelligence. When your leadership team can cross-reference customer acquisition data with long-term accounting metrics, you move from guesswork to verified revenue performance.
The Strategic Value of Unified Revenue Intelligence
Connecting operational workflows with cross-functional analytics elevates business operations from reactive tracking to proactive revenue intelligence. Rather than waiting until the end of a fiscal quarter to discover revenue shortfalls, integrated intelligence flags pipeline decay, margin shifts, and buyer resistance in real time.
Data-driven organizations capture measurable commercial advantages. Research indicates that data-driven businesses are 23 times more likely to attract new customers and six times more likely to retain them. Furthermore, using unified insights to calculate marketing and sales efficiency makes tracking marketing ROI straightforward, linking specific campaigns directly to cash-flow growth.
Why CRM and BI Work Better Together for Customer Insights
When CRM data feeds directly into a centralized BI model, customer behavior metrics become substantially more actionable. A CRM may log that a client has opened three support tickets this month. On its own, this is an operational task for customer care. When combined inside a BI platform that tracks product usage drops and upcoming contract renewals, that same operational record alerts account managers to severe churn risk.
This joined architecture enables advanced customer segmentation based on holistic customer lifetime value (LTV), transaction frequency, and behavioral triggers. By analyzing these dimensions together, marketing and account management teams identify cross-selling opportunities and deploy retention programs before accounts degrade.
Multi-Touch Attribution and Revenue Alignment
Modern buying journeys are rarely linear. A prospect might discover your brand through an organic search query, read an informative industry guide, engage with social content, attend a webinar, and exchange emails with a sales rep before closing.

Standard CRM reports often rely on oversimplified first-touch or last-touch attribution models, assigning 100% of the revenue credit to a single event. BI tools handle multi-touch attribution modeling, distributing value across every marketing touchpoint that influenced closed-won revenue. By using analytics to measure marketing success, revenue leaders can see which specific combinations of content, advertising channels, and sales outreach accelerate pipeline velocity.
Architectural Approaches and Data Governance
Unifying systems requires more than simple point-to-point webhook connections. As data volume scales, connecting visualization dashboards directly to production CRM databases strains system resources and causes reporting latency. Sustainable architectures rely on a structured extraction, transformation, and loading (ETL) pipeline feeding a governed data warehouse.
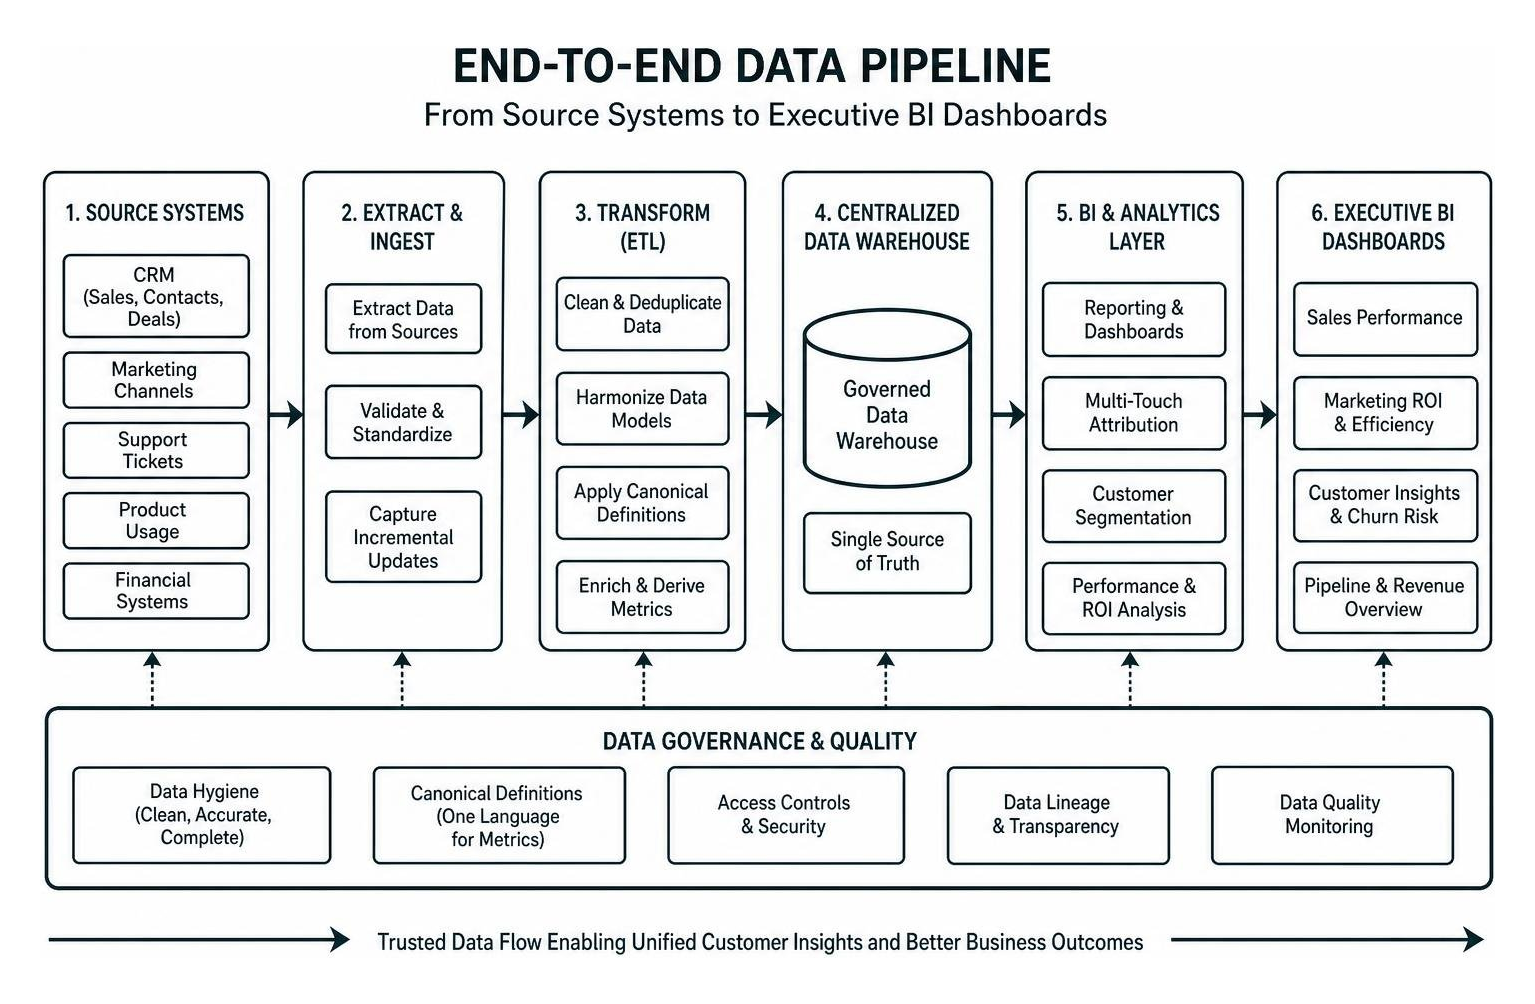
Academic research on system analysis highlights that integrating enterprise CRMs with BI platforms requires harmonized data models and rigorous governance frameworks to capture cross-industry business value (Hamza et al., 2023). Establishing canonical data definitions ensures that sales metrics, operational costs, and executive KPIs speak the exact same language.
Overcoming Technical Hurdles in CRM and BI Integration
Data hygiene is the single largest point of failure during system integration. An estimated 63% of businesses lack a systematic method to reduce dirty data. Incomplete contact records, duplicated company entries, missing lead source tags, and inconsistent pipeline stages undermine analytical models before reporting even begins.
Organizations overcome these technical hurdles by establishing clear data triage processes. Building structured data hygiene into your automated reporting workflows helps scrub duplicate entries, validate mandatory property fields, and enforce standardized data entry across departments. Teams should maintain field completion rates above 85% to ensure BI models generate accurate predictive forecasts.
Master Data Management and Security Controls
Unifying disparate platforms introduces security, compliance, and governance requirements. Master data management (MDM) ensures that an entity, such as an enterprise client account, matches correctly across CRM records, billing software, and customer support databases.
Key data governance standards include:
- Canonical Data Modeling: Defining standard naming conventions and schema definitions across all business applications.
- Identity Resolution: Matching disparate customer identifiers across tools to prevent fragmented reporting.
- Row-Level Security: Enforcing permission boundaries within BI dashboards so sales representatives only view their assigned territory data while regional leaders review aggregated numbers.
- Compliance Auditing: Maintaining encryption protocols and data retention schedules compliant with regional and international privacy standards.
Designing Decision-Ready Dashboards and Analytics Models
A dashboard should never serve as a decorative vanity wall of vanity metrics. High-impact dashboard architecture focuses strictly on decision intelligence, presenting data that answers specific commercial questions and prompts immediate operational adjustments.
Essential Components of an Executive Revenue Dashboard
An effective executive revenue dashboard cuts through administrative noise to spotlight performance drivers, resource allocation needs, and financial risks.
- Marketing and Pipeline Velocity: Real-time tracking of marketing-sourced pipeline, qualified lead velocity, and stage-by-stage conversion efficiency.
- Unit Economics and Efficiency: Customer Acquisition Cost (CAC), Customer Lifetime Value (LTV), CAC payback periods, and margin contributions broken down by channel.
- Revenue and Forecast Accuracy: Real-time comparison of closed-won revenue against quarterly sales quotas, combined with historical weighted win rates.
- Customer Health and Churn Alerts: Early warning indicators combining product activity, support ticket escalations, and contract renewal timelines.
- Channel Performance Attribution: Multi-touch marketing attribution linking specific paid, organic, and outbound touchpoints directly to pipeline growth.
AI-Powered Predictive Analytics and Conversational Reporting
Artificial intelligence is transforming business analytics from backward-looking historical reviews into forward-looking predictive engines. By 2018, 90% of marketing teams were already using BI tools to execute their work, and adoption doubled rapidly across sectors. Today, modern AI models integrated into CRM and BI ecosystems continuously scan data sets to detect anomalies, surface patterns, and optimize forecasting.

AI algorithms analyze historical win-loss records alongside real-time rep activity to generate predictive lead scores and flag deals at risk of stalling. Furthermore, conversational reporting capabilities allow executive leaders to query multi-layered enterprise data sets using natural language prompts, instantly visualizing complex trends without submitting ad-hoc requests to data engineering teams.
Frequently Asked Questions About CRM and BI
What is the primary difference between a CRM report and a BI dashboard?
A CRM report relies exclusively on transactional records within your customer management software, focusing on immediate operational activities such as open tasks, daily call volumes, and current deal stages. A BI dashboard extracts data from multiple business platforms, including CRM, ERP, billing software, and marketing platforms, to provide cross-functional, historical, and predictive analysis across the entire organization.
Why do CRM and BI integration projects often fail?
Most integration projects falter due to poor data quality, mismatched metric definitions, and lack of clear governance rather than software limitations. When source data contains widespread duplicates or missing fields, stakeholders lose trust in the resulting dashboards. Projects also fail when teams focus purely on technical connectivity without defining specific business questions or planning user adoption workflows.
How does artificial intelligence enhance CRM and BI workflows?
Artificial intelligence enhances integration by automating data cleanup, identifying hidden behavioral trends, and generating predictive models for deal closures and customer churn. It also powers natural language querying, enabling non-technical team members to ask questions in plain language and instantly generate visual analytics from complex data warehouses.
Conclusion
Operational customer records contain immense untapped value, but they only tell part of your commercial story. Bridging CRM and BI transforms isolated data points into actionable revenue intelligence, aligning marketing spend, sales pipeline velocity, and customer retention strategies.
Achieving clean data models and reliable revenue attribution requires thoughtful technical architecture and disciplined governance. At ELMNTL, we help growing brands turn fragmented customer touchpoints into integrated growth engines. To discover how our strategic advisory, data modeling, and digital execution can scale your business, explore ELMNTL digital marketing and analytics consulting today.
References
Oladimeji Hamza, Anuoluwapo Collins, Adeoluwa Eweje, Gideon Opeyemi Babatunde. “A Unified Framework for Business System Analysis and Data Governance: Integrating Salesforce CRM and Oracle BI for Cross-Industry Applications.” International Journal of Multidisciplinary Research and Growth Evaluation, 2023. DOI 10.54660/.ijmrge.2023.4.1.653-667.